
Jayant Mamania
Jayant leads the investment team, bringing more than 30 years of experience in Indian equities. His stock-selection discipline is central to the firm’s investment process and to its standing as a portfolio manager.
Introduced in July 2011, the investment approach targets companies across market capitalisations, selecting businesses with attractive valuation multiples and the potential for higher growth-rate triggers.
Introduced in July 2011, the investment approach targets companies across market capitalisations, selecting businesses with attractive valuation multiples and the potential for higher growth-rate triggers.
It prioritises industry leaders and allocates more heavily to small-cap companies that demonstrate substantial growth potential as well as value, hence the name Growth Plus Value. Investments are intended for longer holding periods, to capitalise on management-driven business growth and potential valuation re-rating.
A typical portfolio comprises 18–20 companies from various industries, selected systematically through a model-portfolio approach. The objective is to outperform benchmark indices over the long term by identifying fundamentally strong businesses. This dual focus on growth and value seeks to deliver sustained capital appreciation and wealth generation for investors, underpinned by strong conviction in each investment idea.
The curve illustrates the stated CAGR, not the month-by-month path.
Asset allocation, market-capitalisation mix, and sector and company exposure, as reported in the latest monthly factsheet.
Invest in Indian listed companies via fundamental, research-backed ideas to compound capital over the long term, with a greater allocation to small caps.
Portfolio data as on 30 September 2026, in nearest percentages. Returns are not verified by SEBI.
Values in percentage, as on 30 September 2026, as published in our monthly factsheet.
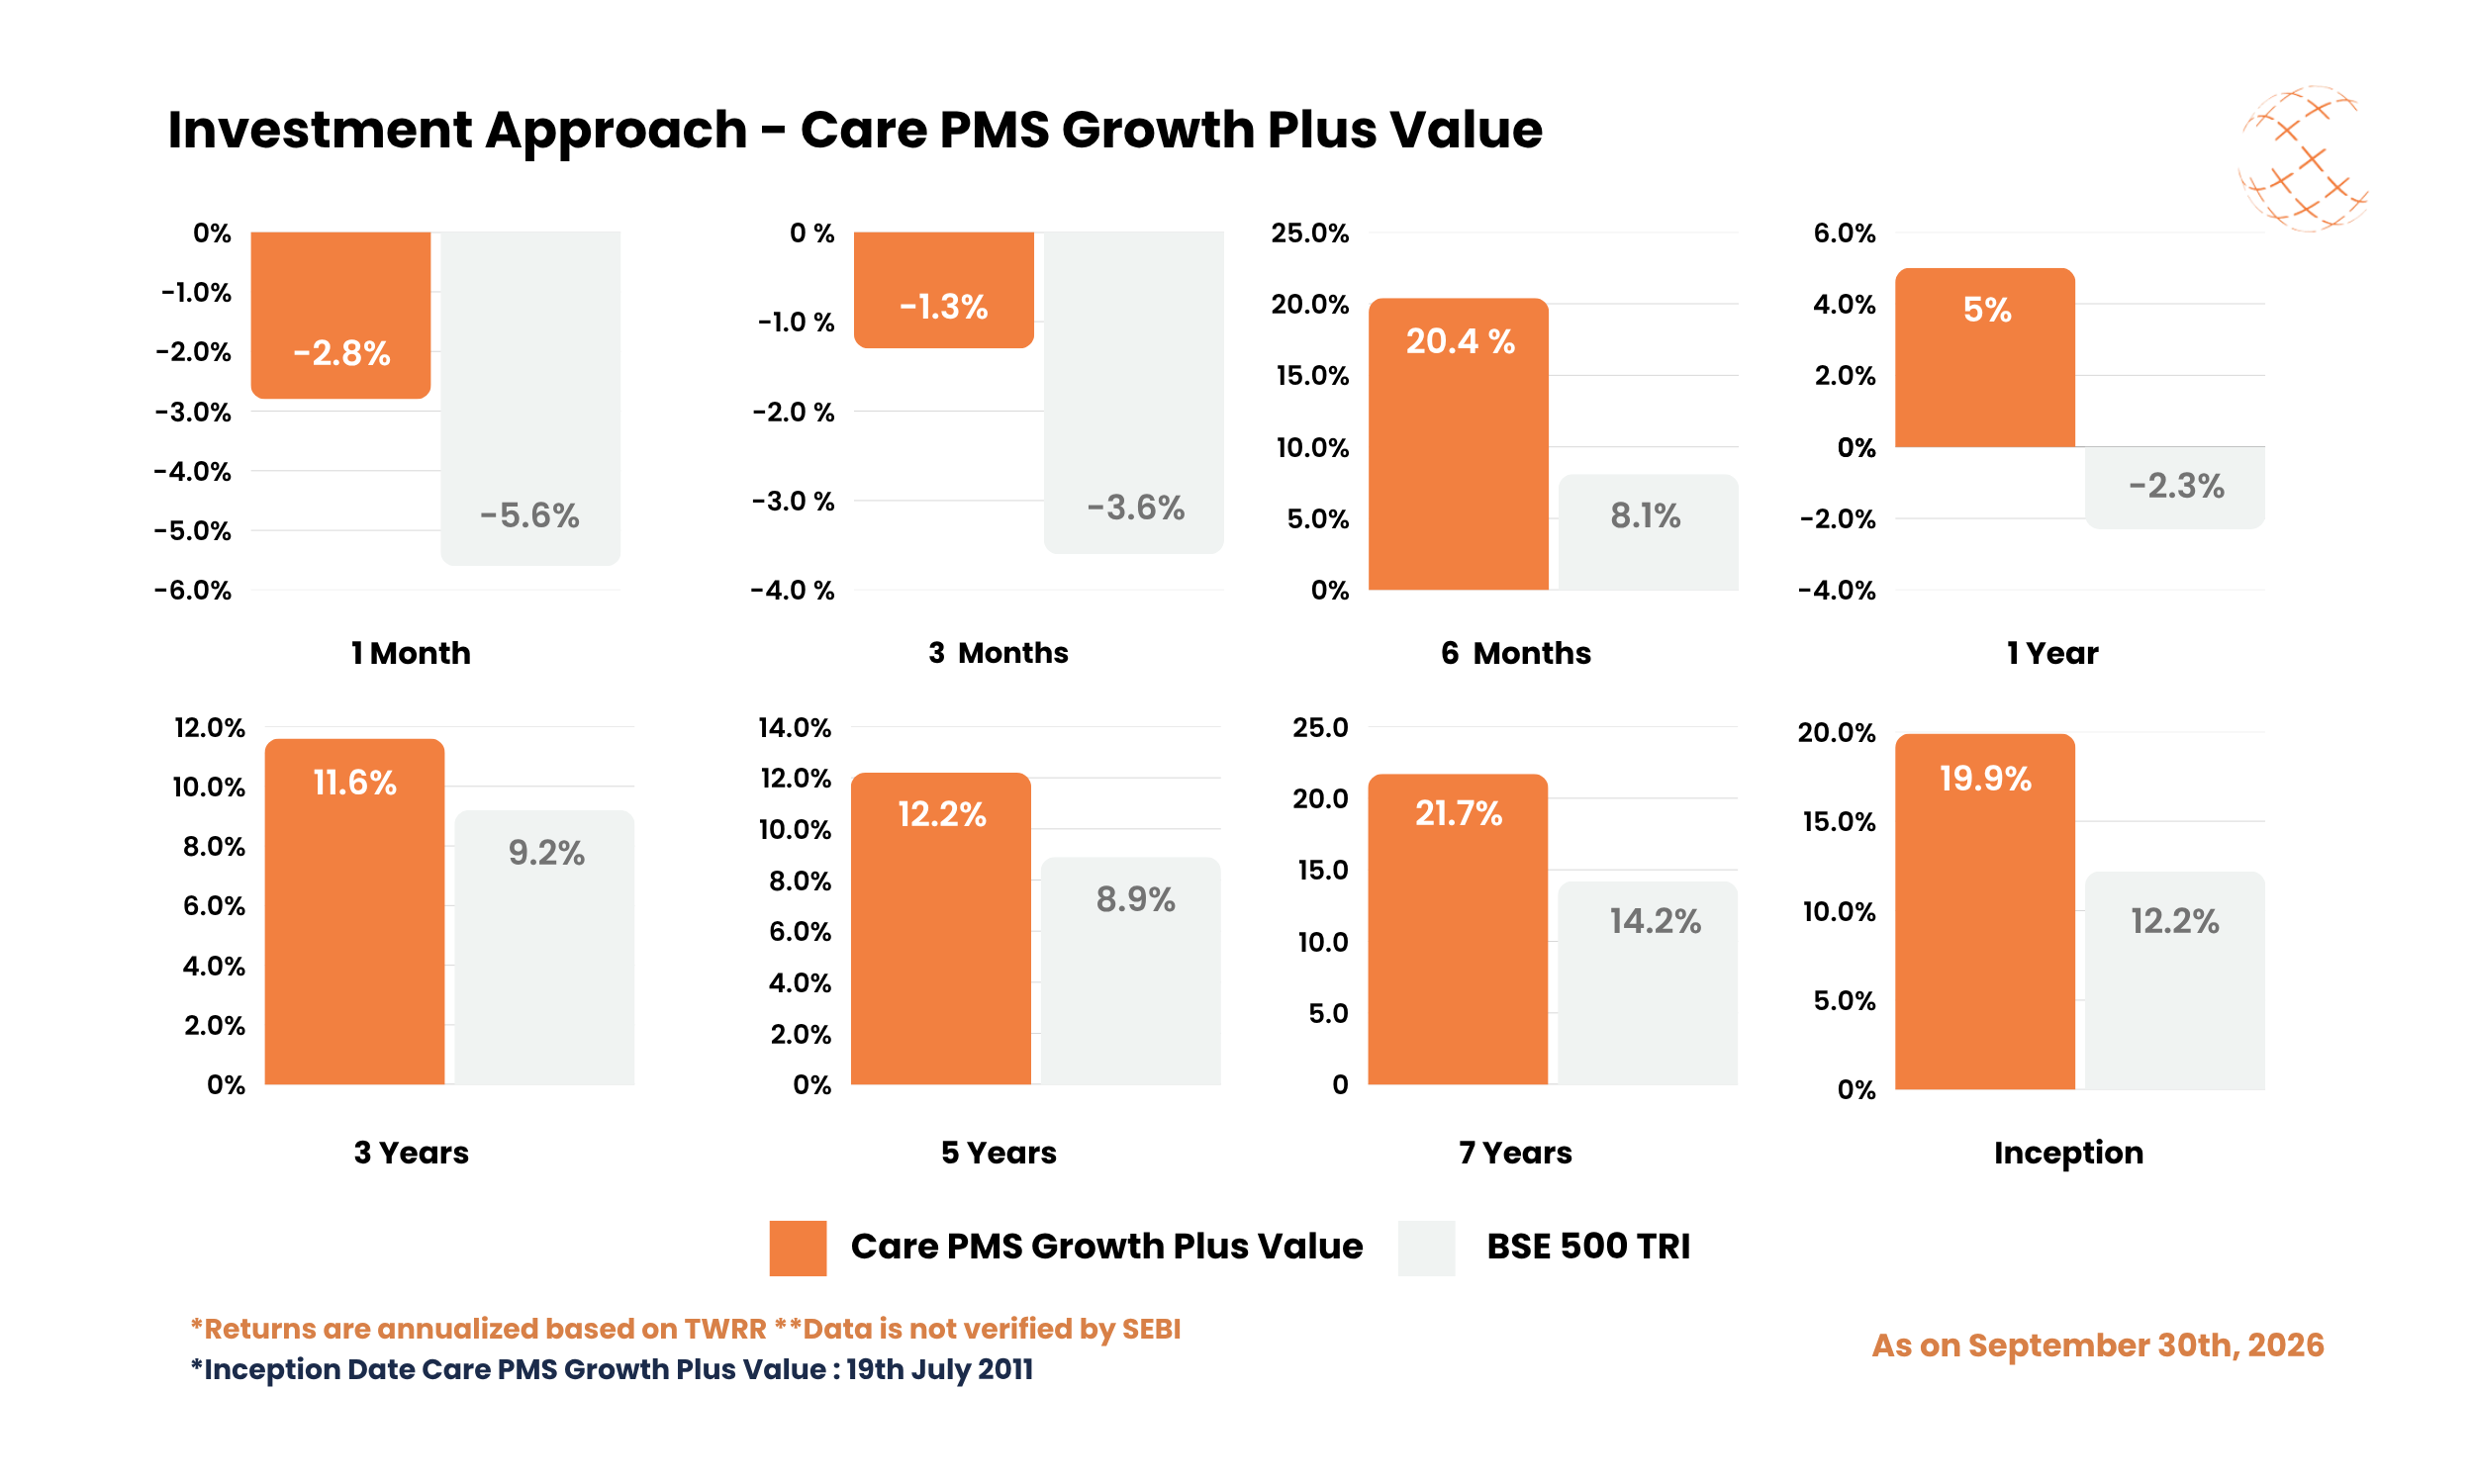
Investments in equities are subject to market risk. Past performance is not indicative of future returns. Please read the disclosure document carefully before investing. Returns are not verified by SEBI.
Clients may choose a fixed or a hybrid fee structure. Illustrations and a fee calculator are provided for full transparency.
| Fees | Fixed | Hybrid |
|---|---|---|
| Management feeper annum | 2.5% | 1% |
| Performance feeas per the disclosure document | Nil | 10% |
Jayant leads the investment team, bringing more than 30 years of experience in Indian equities. His stock-selection discipline is central to the firm’s investment process and to its standing as a portfolio manager.

A founder director and Chartered Accountant with more than 18 years of capital-market experience. A first-generation entrepreneur, Arpit leads in-depth research and business development, and shapes the firm’s strategic growth.

A Chartered Accountant who spent more than seven years at PwC before joining the core team in 2010. Amit has played a central role in the firm’s growth over the past 15 years and is responsible for portfolio-company research and the finance function.
Compare both approaches to identify the right fit for your horizon and risk appetite.
Invest directly with a SEBI registered portfolio manager, as a resident or a non-resident investor. Contact us at connect@carepms.com and our team will guide you through every step.
A conversation with our team about your objectives, investment horizon and risk appetite, and the approach best suited to them.
A PMS bank account and demat account are opened in your name. You sign the PMS agreement and grant the Power of Attorney.
Invest fresh funds of ₹50 lakh or more, or introduce an existing portfolio. Statements and reporting follow every month.
 SEBI registered portfolio manager · since 2011
Our firm, investment philosophy, process, investment approaches and team, in one concise reference.
Trouble viewing the brochure? Open it in a new tab or download the PDF.
Share a few details and a senior member of our team will contact you to discuss your objectives.
Your enquiry is ready to send. A member of our team will be in touch shortly.